The Software Productivity Reset
What a decade of revenue per employee data tells us

Why This Matters
Most software investors have formed a view in the last three years that the business of building software got more efficient. Layoff announcements, AI coding tools, and a new discipline on headcount have all been credited. We wanted to level set this with a clean measurement of how much more productive the industry is, who got more productive, and whether that productivity gain showed up in stock returns. This piece answers those three questions using a locked universe of 46 US listed software majority companies with continuous data from FY2016 through FY2025.
We felt this could be an interesting exercise to do prior to the massive productivity gains AI is promising to unlock within Enterprise starting with coding and customer support and permeating across the organizations. If the promise unfolds as it is made (we believe it does), we should expect a dramatic rise in productivity in the next few years. We will be looking at evidence of this as product velocity picks up and with increased AI tool usage both in new product build, as well as in distribution and customer service.
Three findings sit underneath this baseline analysis. First, the productivity lift is real and it is concentrated in FY2021 to FY2025 (post covid rationalization). Second, small cap software companies are now as productive as mega caps were three years ago. This is important directional learning for lower middle market businesses we are focused on at Cover Drive. Third, when we ask whether the companies compounding productivity fastest also delivered the best shareholder returns.
All figures are medians, computed separately within each cohort to prevent outliers from driving means (e.g. MSFT at $1.2M Rev/FTE, VRSN at $1.8M would distort any mean based read of the group).
The productivity reset is a FY21 to FY25 phenomenon
We bucketed the 46 companies by FY2025 revenue into four size quartiles, held those quartiles constant across years, and traced Rev/FTE backward. This approach asks a specific question: for the companies that occupy each size tier today, what did their productivity look like at earlier points in time? It avoids survivorship tricks and isolates the cohort movement cleanly.
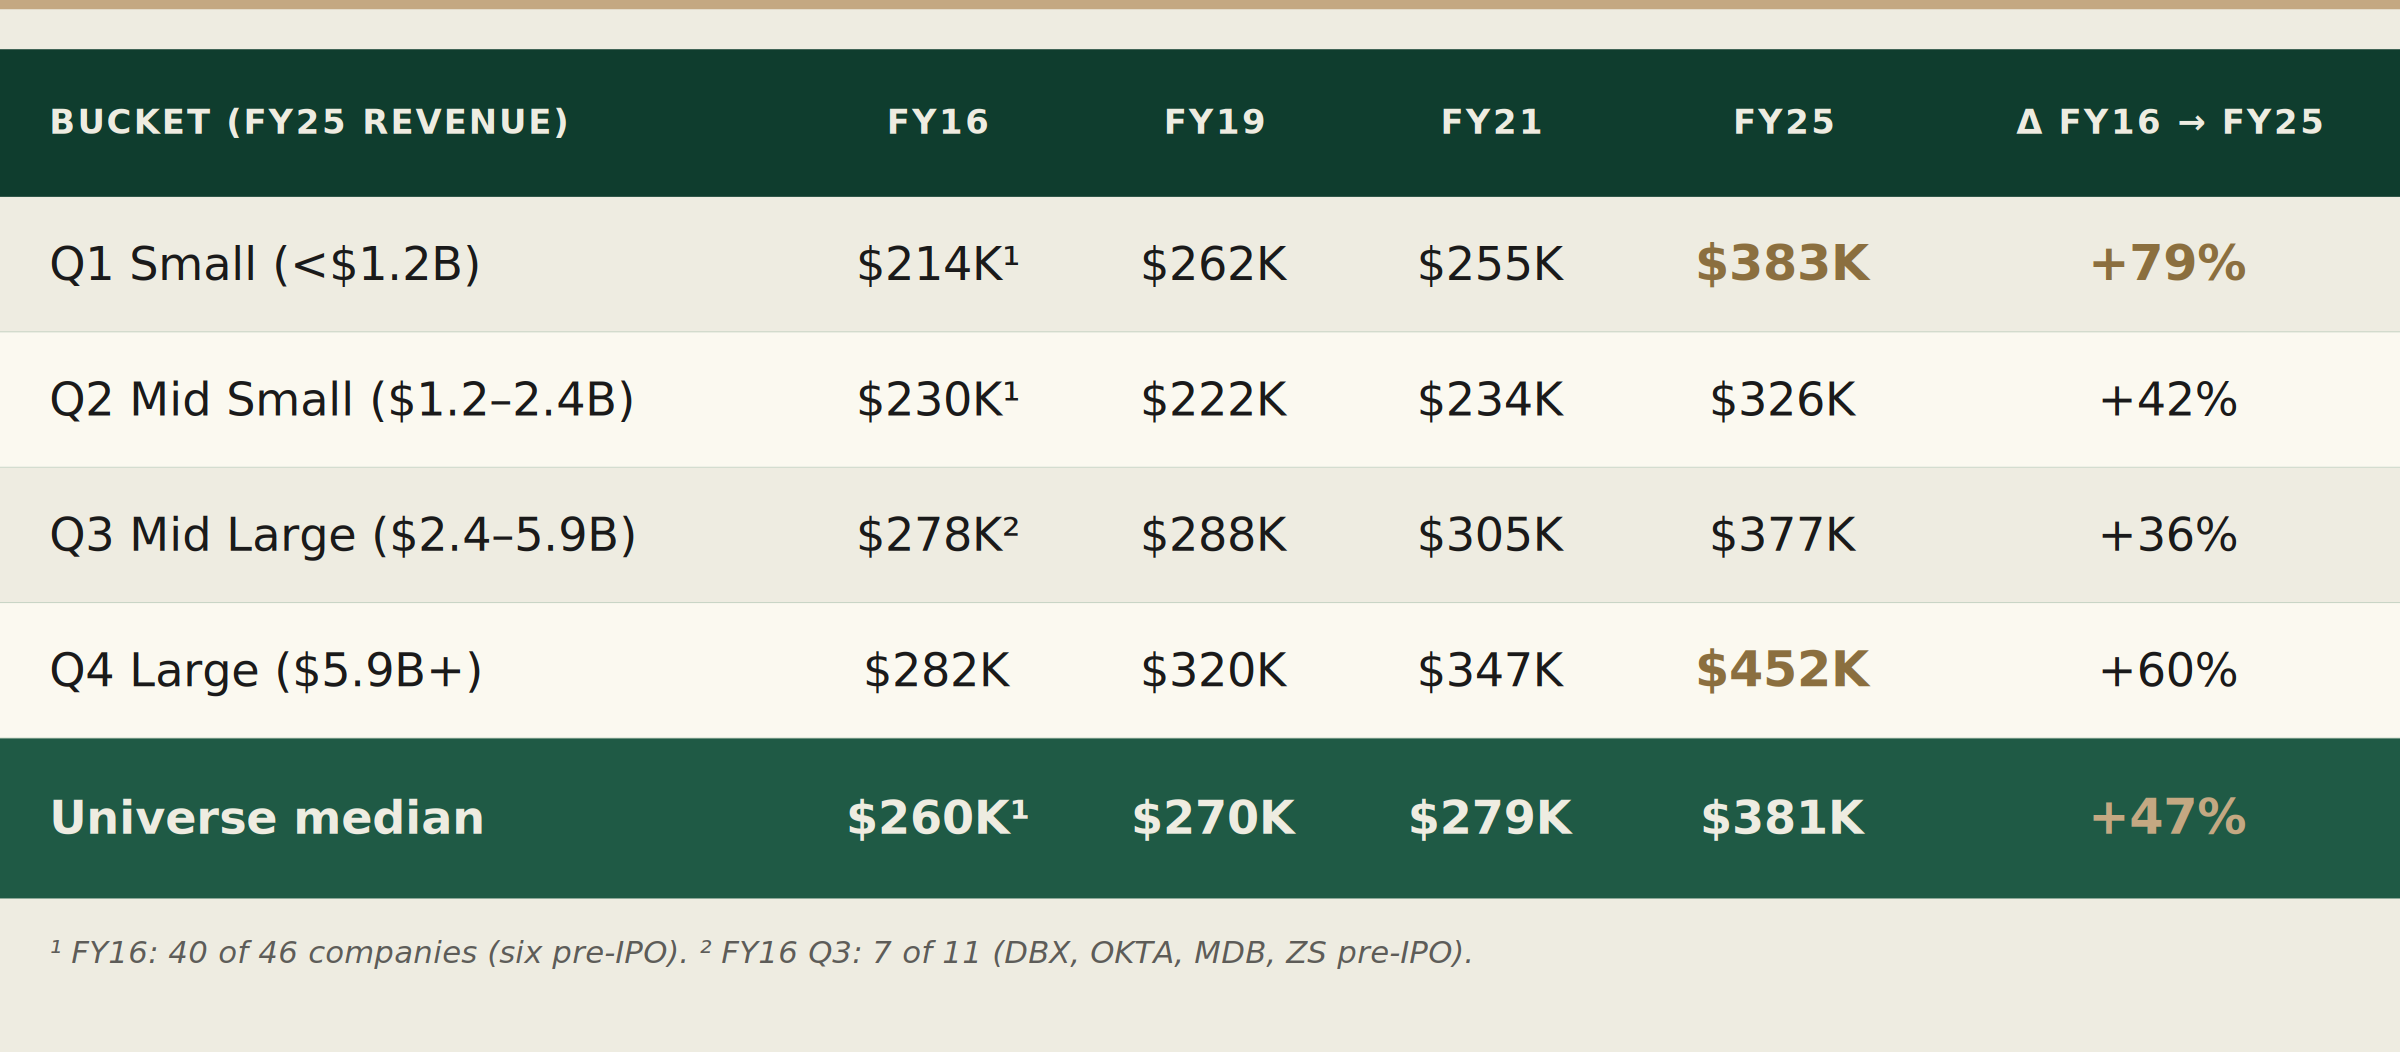
The universe median moved from $260K in FY16 to $279K in FY21, essentially flat at +7% over five years. Then from $279K to $381K in the next four years, a gain of +37%. The productivity lift the industry talks about is real and it is a post COVID story. Generally no surprise here vs perception. We believe a lot of this is driven by staffing rationalization after a period of excessive hiring, and AI related gains are still to come in significant magnitude.
FY19 to FY21 looked like productivity stagnation but it was actually headcount inflation masking the underlying economics. Rev/FTE moved only +3% while total cohort FTE went from 530K to 643K. Companies added 113,000 employees over two years and hired at roughly the pace of revenue growth. FY19, not FY21, is the clean precycle baseline, and the real acceleration begins when the hiring discipline returns in FY22 to FY23.
The standout cohort is Q1 Small. Its median climbed +79% over nine years, the biggest gain in any bucket. Q1's FY25 median of $383K now exceeds Q2 Mid Small at $326K and essentially matches Q3 Mid Large at $377K. The small cap productivity disadvantage has disappeared. Today's small caps are operating at the productivity level that Q4 Large did not cross until FY23. Roughly seven years of scale premium has been compressed into small cap operating models. This observation is most applicable to where we focus on at Cover Drive.
Revenue growth and productivity growth are tightly linked
We wanted to see how productivity growth mapped to revenue growth. Alternatively said, are the companies growing revenue fastest also the ones demonstrating the highest operating leverage, measured on employee productivity?
We split the 46 company cohort into four revenue CAGR quartiles, using each company's earliest observable year through FY25 as the measurement window.
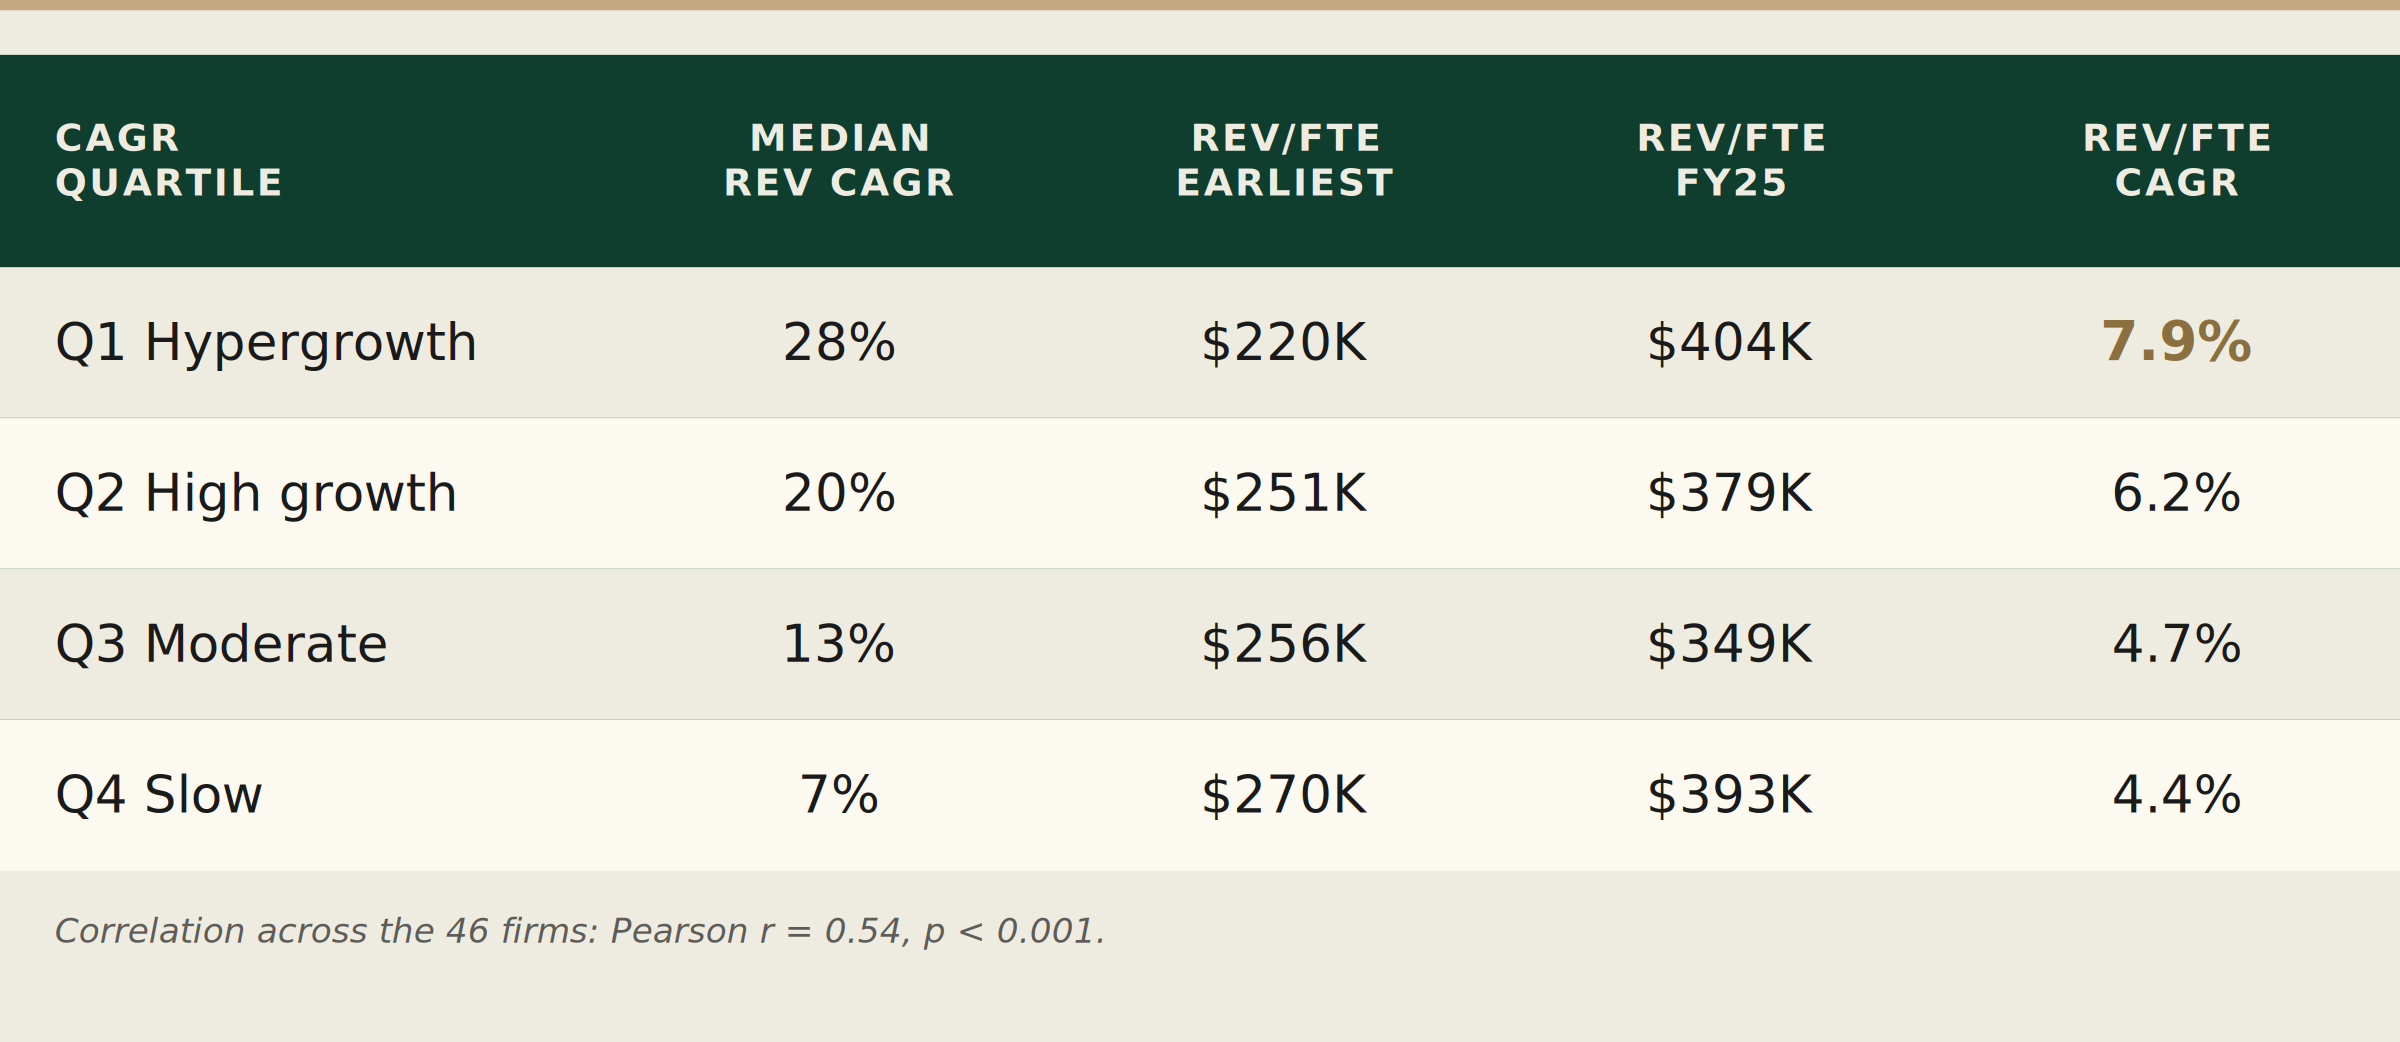
The Rev/FTE CAGR column moves monotonically with revenue CAGR, and each step up in revenue growth tier adds roughly 1.5 points of annualized productivity compounding. Companies that grew revenue fast also compounded Rev/FTE fast because their revenue expansion outpaced their hiring even as they hired aggressively. Q1 Hypergrowth grew headcount at roughly 20% per year and still generated 7.9% of productivity leverage on top of that.
Focus on the rate of change column contrasted with the level column. Q4 Slow ends at $393K only because it started at $270K, the highest base in the matrix, and compounded at the slowest rate. The cleanest read is Q1: today's fastest growers started at $220K in FY16, 15% below the universe median, and ended at $404K, 6% above it. A full reversal of productivity position in nine years.
Productivity gains and stock returns
We wanted to see how the stocks performed against the productivity gains. This analysis is inherently noisy given the entry and exit points, so we lean on medians within each quartile and compare to broad benchmarks. We capped stock performance at December 2024 given the volatility in 2025 and early 2026 stock prices on account of perceived impact of AI, which would contaminate the read on the preceding cycle.
We split the 46 company cohort into four quartiles by Rev/FTE CAGR (earliest year to FY25) and measured TSR from January of each company's starting year through December 2024.
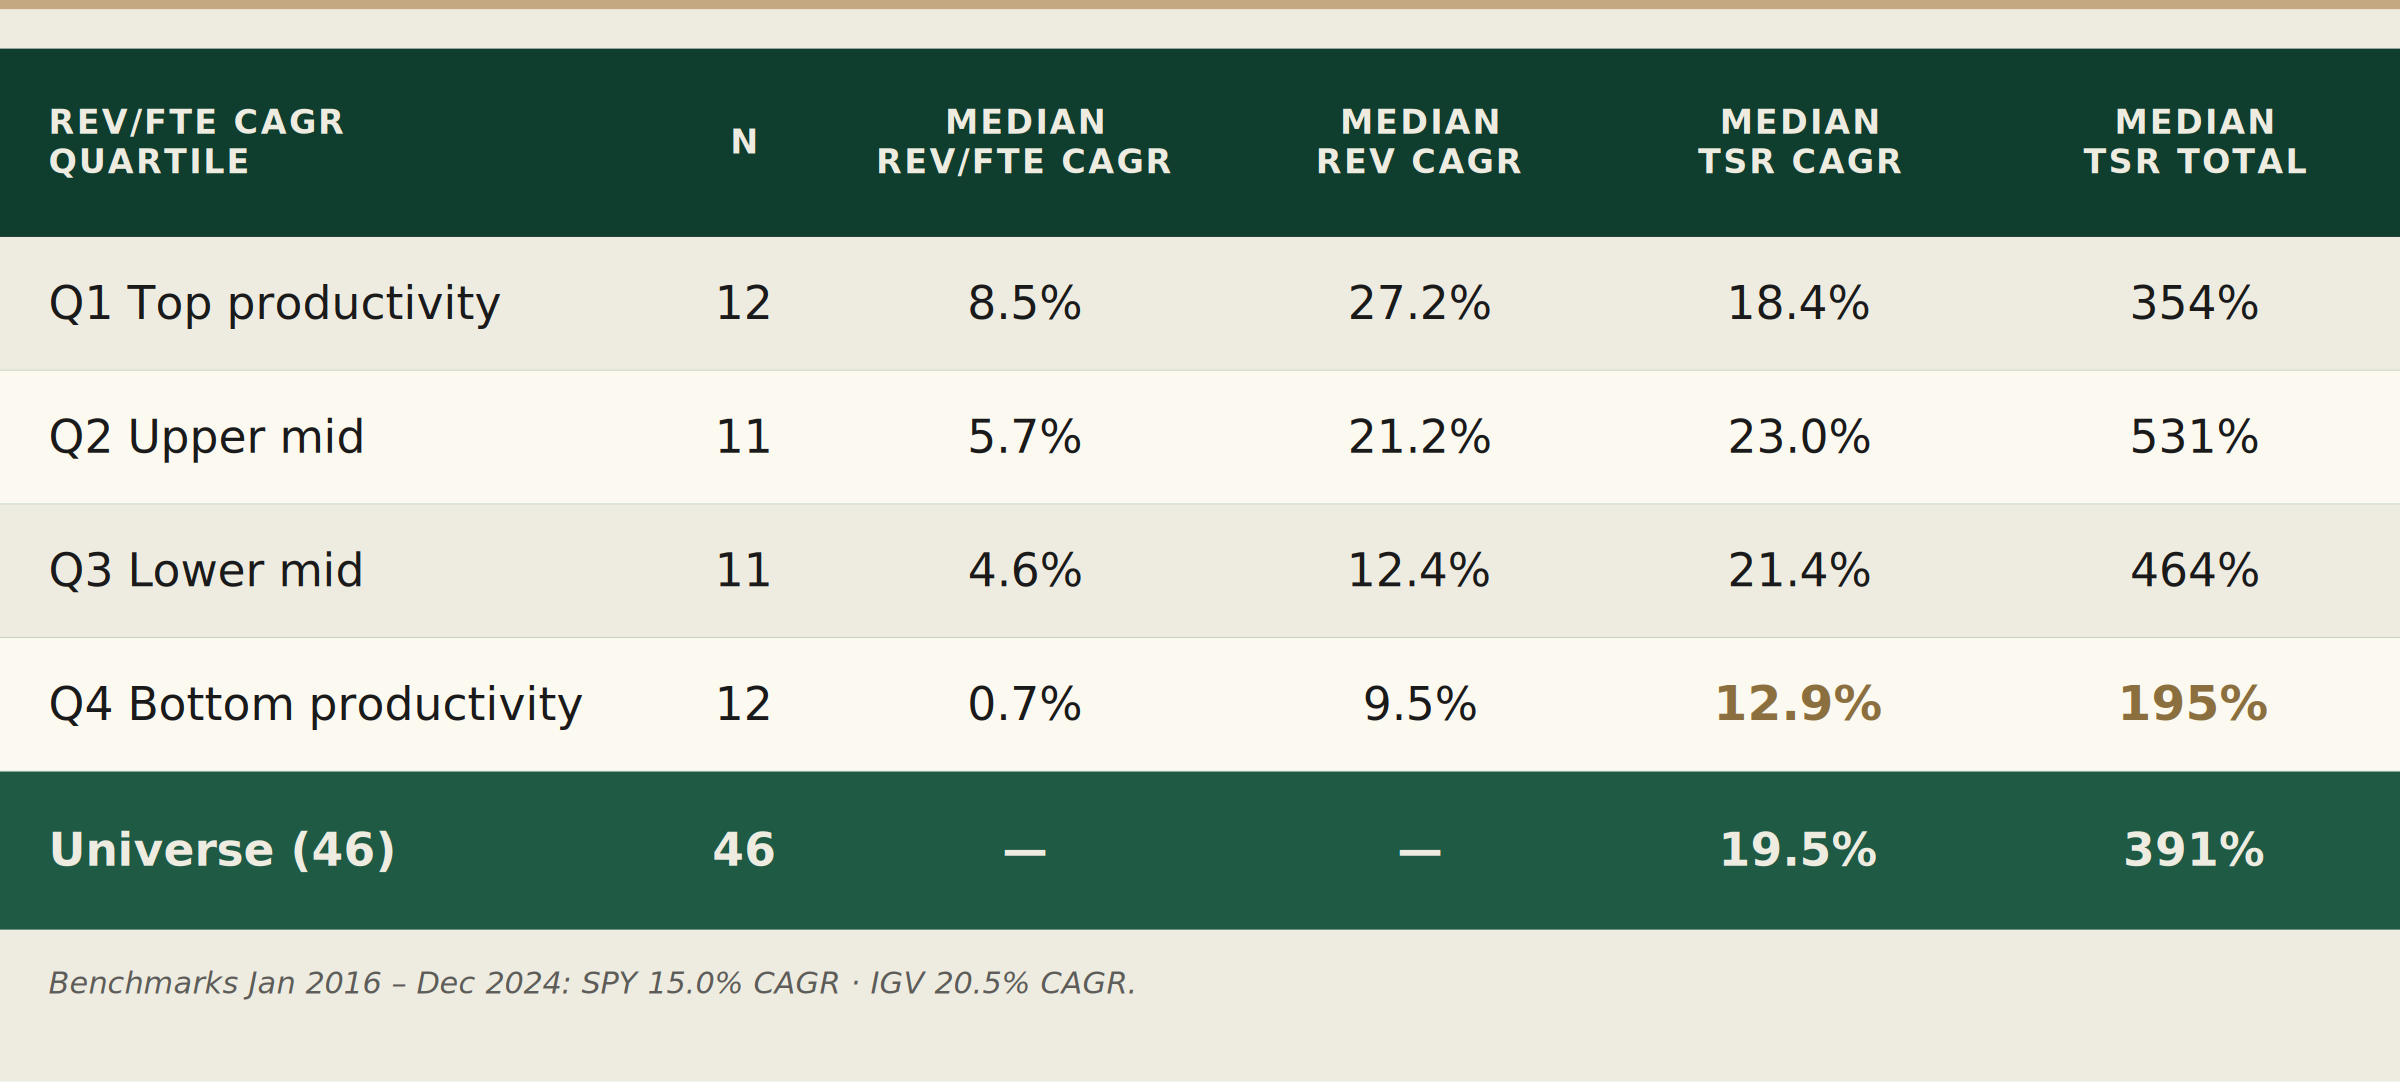
Focus on the bottom productivity quartile. Q4 Bottom delivered median 12.9% TSR CAGR, 2 points below SPY and nearly 8 below IGV. The top three quartiles all clustered between 18% and 23% CAGR with no clean ordering among them, and entry and exit noise is large enough to swamp any finer read. The way to say it plainly: strong productivity compounding does not guarantee a stock winner in and of itself, but weak productivity compounding reliably prevents one.
What we take away
Three reads sit at the top of the stack after going through this exercise.
First, the productivity reset in software is real, it is concentrated in the last four years, and it has been most dramatic for the smallest companies in the universe. The operating leverage that used to belong to scale is now available at much smaller scale.
Second, revenue growth and productivity growth are tightly coupled. This is less intuitive than it sounds. It means the fastest growing software companies are not just adding more bodies to chase more revenue. They are generating real operating leverage per employee on top of the growth, at a rate that compounds meaningfully over a decade. They are executing both levels.
Third, Companies that fail to compound productivity underperform. Companies that compound productivity well end up in a cluster where valuation entry points, growth durability, and narrative effects explain most of the spread. This is a useful caution for anyone using Rev/FTE CAGR as a stock picking signal in isolation.
The underlying question we are most interested in as a fund is whether this productivity curve keeps compounding. If the FY21 to FY25 lift was a one-time reset driven by layoffs plus a first wave of AI tooling, the universe should flatten back out. If instead we are watching the first four years of a multi-year structural shift, about to get on steroids with agentic productivity gains, where software companies operate at fundamentally higher revenue per employee, then the right new benchmarks need to be rewritten. The data we have so far is consistent with the second story.
The data is consistent with three Cover Drive beliefs. First, small cap and lower middle market software businesses now operate at a higher productivity base than at any prior point in the cycle. Second, the filter of growth plus capital efficiency is not a tradeoff but a co-occurrence, which is what the Rev/FTE compounding profile of the hypergrowth quartile demonstrates. Third, productivity compounding is a necessary screen for avoiding underperformance. We are focused on capital efficient businesses that have a strong baseline to lean into and benefit from AI transformation.
Methodology
Universe: 46 US listed software majority companies with continuous FY16 to FY25 data.
All figures are medians computed separately within each bucket.
Revenue and Rev/FTE sourced from annual filings (10 K) via EDGAR.
TSR computed from monthly adjusted close prices, equal weighted, Jan 2016 (or first full month post IPO) through Dec 2024.
Interested in receiving more insights from Cover Drive Partners?
Subscribe below.